
What You’ll Learn
- Where to access Dashboard Insights and its settings page
- How the shared settings work
- How to filter Insights data for specific date ranges, tags, clients, and users
- How to export widget charts and data
Prerequisites
- MainWP Dashboard with connected child sites
- Network Activity logging enabled in MainWP > Settings > Network Activity Settings
- Recent activity data in your Dashboard or child sites
Access Dashboard Insights and Settings
1
Open Dashboard Insights
Go to MainWP > Insights (
admin.php?page=InsightsOverview).2
Open Insights settings
Go to MainWP > Settings > Network Activity Settings (
admin.php?page=SettingsInsights).The settings page is named Network Activity Settings because it is shared.
Network Activity and Dashboard Insights use the same underlying logs dataset, but each feature presents it differently.
Network Activity and Dashboard Insights use the same underlying logs dataset, but each feature presents it differently.
Use the Widgetized Insights Dashboard
Insights is widgetized like Operations pages. You can show or hide widgets, move them, and keep a personalized layout.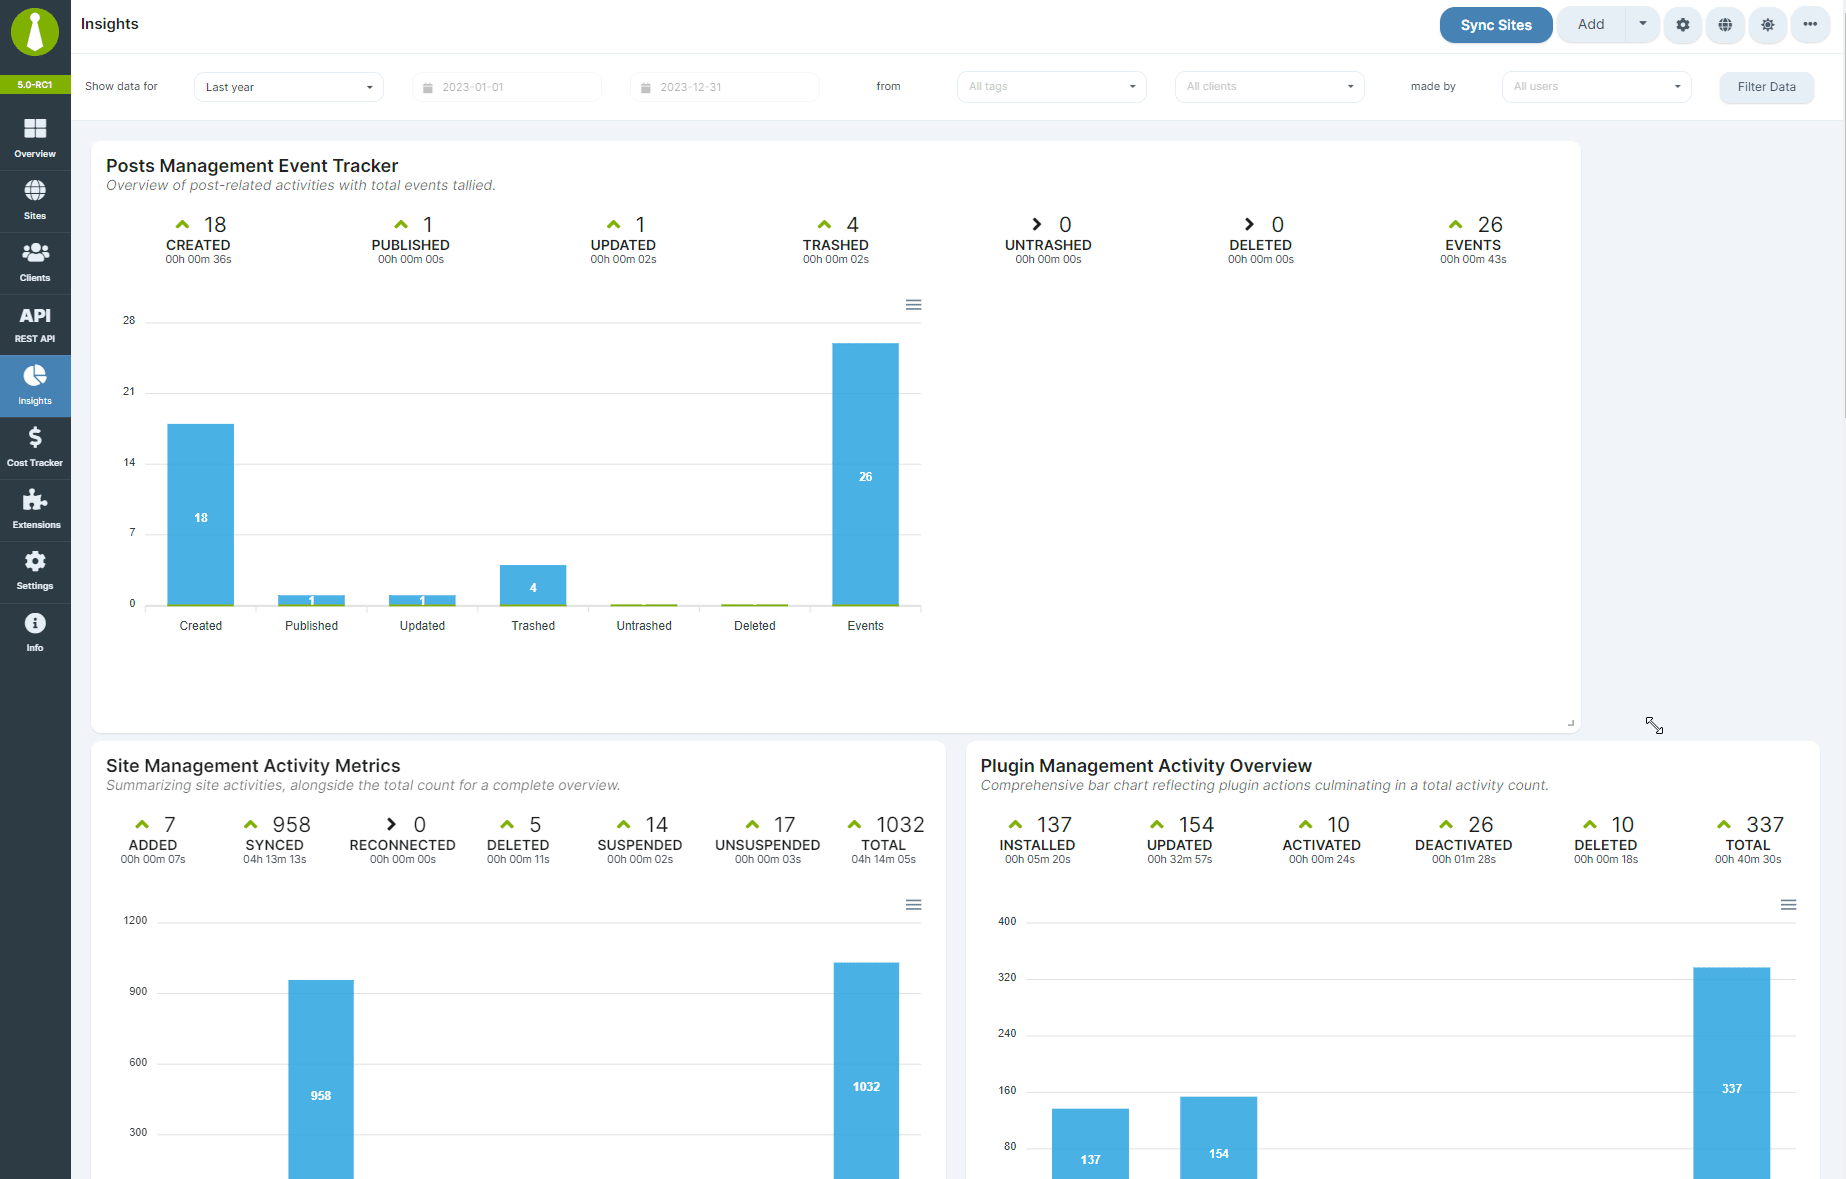
Filter Insights Data
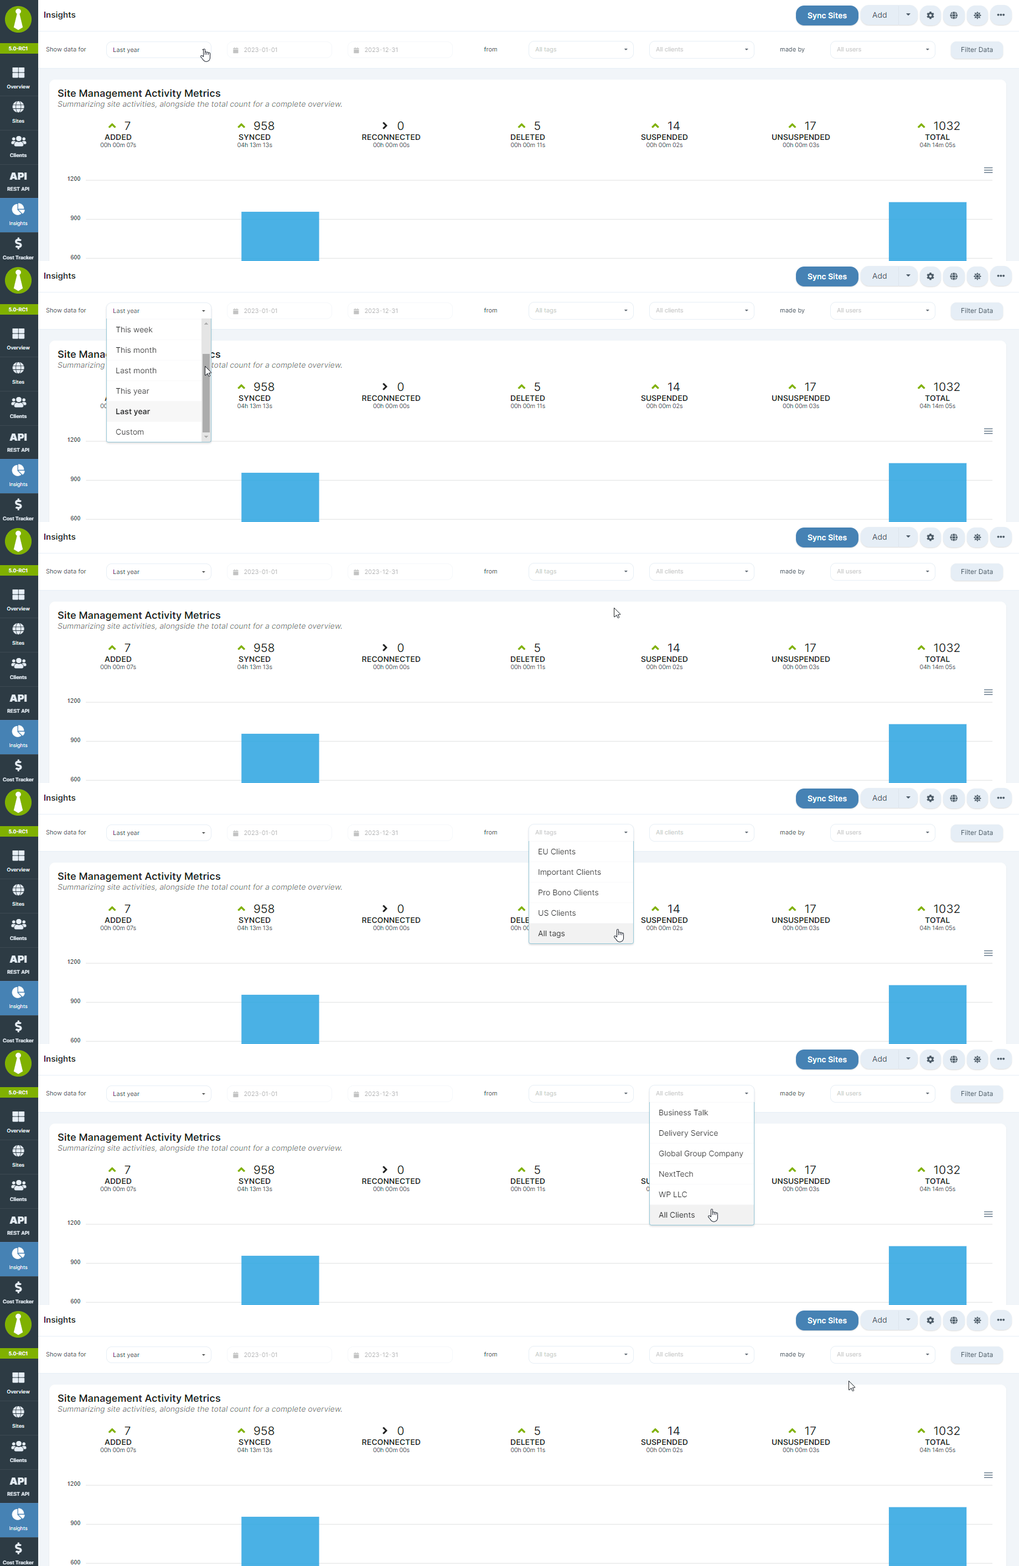
Use the filter controls at the top of Insights to narrow analytics by:- Date range (including custom range)
- Tags
- Clients
- Users
Export Widget Data and Charts
1
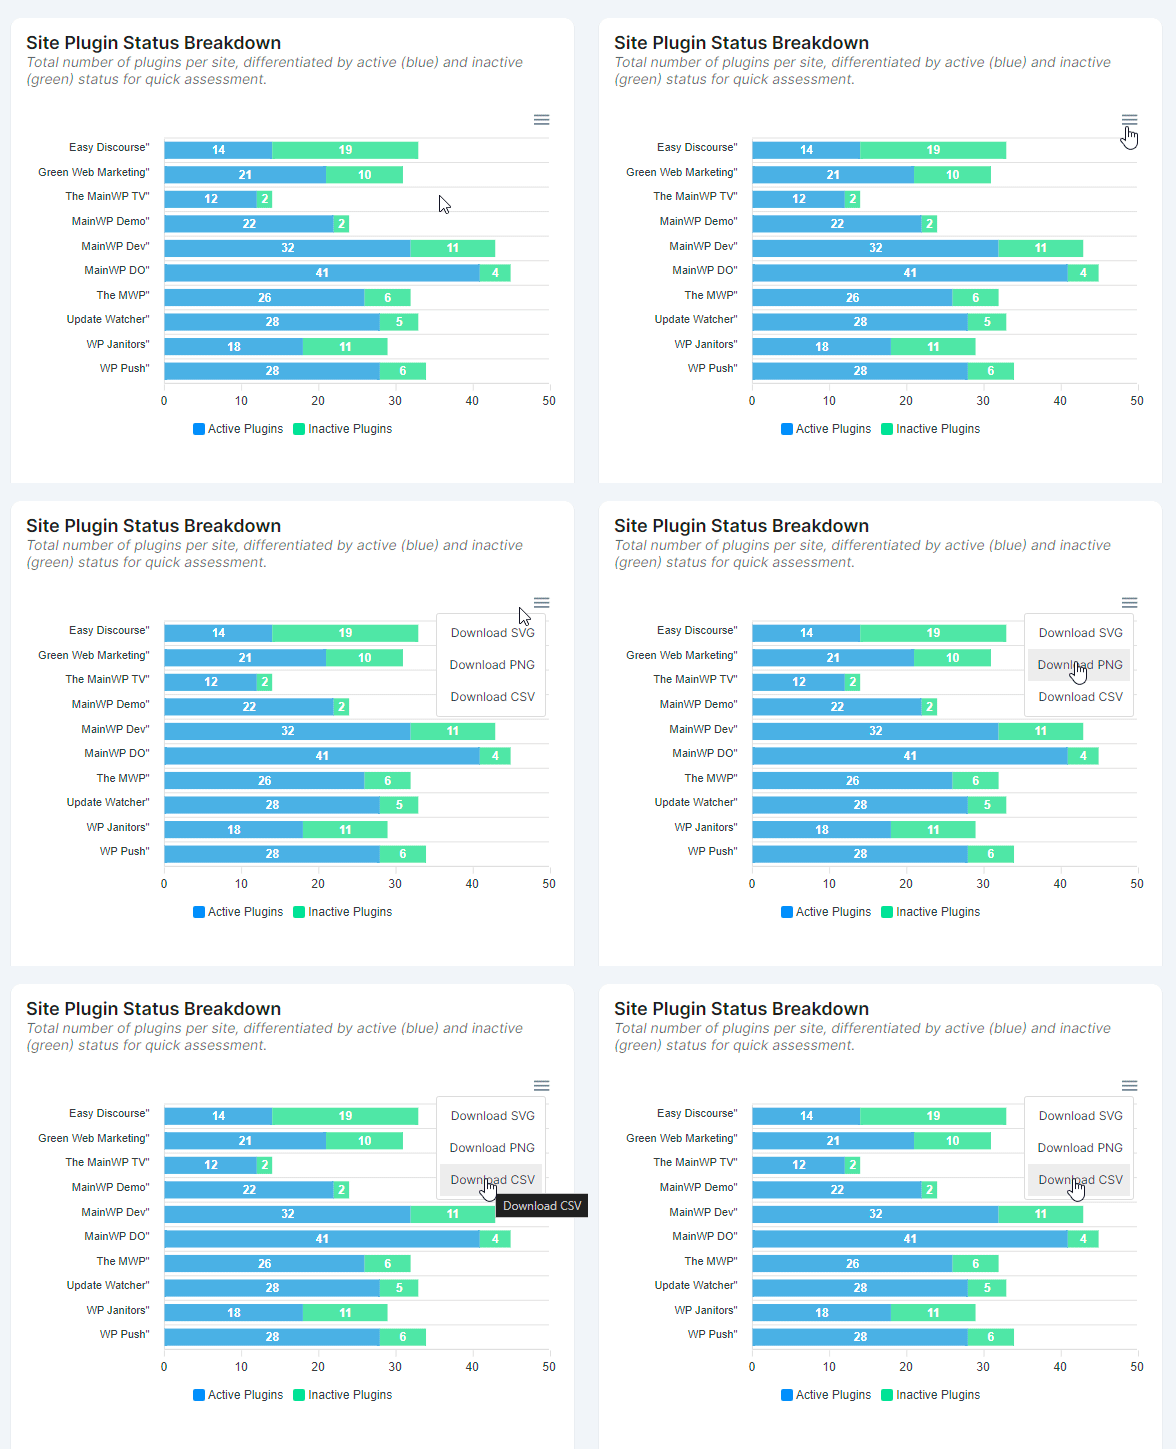
Open a widget menu
Click the three-line menu in the top-right of the widget.
2
Choose export format
Select SVG, PNG, or CSV.
3
Download and use the export
Use image exports for reports and CSV exports for deeper data analysis.
Related Resources
- Network Activity - Review detailed event timelines
- What Does Dashboard Insights Track? - Full tracked event reference
- REST API Overview - Extend reporting with API workflows